Introduction
When it comes to trading, it can feel like trying to predict the weather. You can’t control the market, but you can try to read its signals. Chart patterns are like the clouds in the sky, helping traders figure out if a storm or a sunny day is on the horizon. Understanding these patterns allows you to make more informed decisions.
What Are Chart Patterns?
Simply put, chart patterns are shapes that form on price charts. These shapes tell a story about the supply and demand of a security. When traders recognize these patterns, they can use them to predict future price movements. It’s like seeing a roadmap in the market, helping you navigate your way to smarter trades.
Types of Chart Patterns
Chart patterns are usually categorized into two main types: continuation and reversal patterns. A continuation pattern suggests that the current trend will continue, while a reversal pattern signals a change in direction. Knowing which type you’re looking at can help you anticipate what’s coming next.
How to Read a Chart Pattern?
Reading a chart pattern isn’t as tricky as it might seem. Imagine you’re putting together a jigsaw puzzle. Each price movement is a piece, and as the pattern develops, you start seeing the bigger picture. By focusing on the highs, lows, and overall direction, you can identify whether the market is gearing up for a continuation or reversal.
Bullish vs Bearish Patterns
Chart patterns also come in two flavors: bullish and bearish. A bullish pattern indicates that the price is likely to rise, while a bearish pattern suggests a decline. Think of a bull pushing the market upward with its horns, while a bear swipes it down with its paws. Recognizing these patterns can give you an edge when entering or exiting trades.
Common Chart Patterns Explained
Here are some of the most common chart patterns traders watch for:
- Head and Shoulders
- Double Top and Double Bottom
- Triangles (ascending, descending, symmetrical)
Each of these patterns provides clues about market psychology and potential price movements.
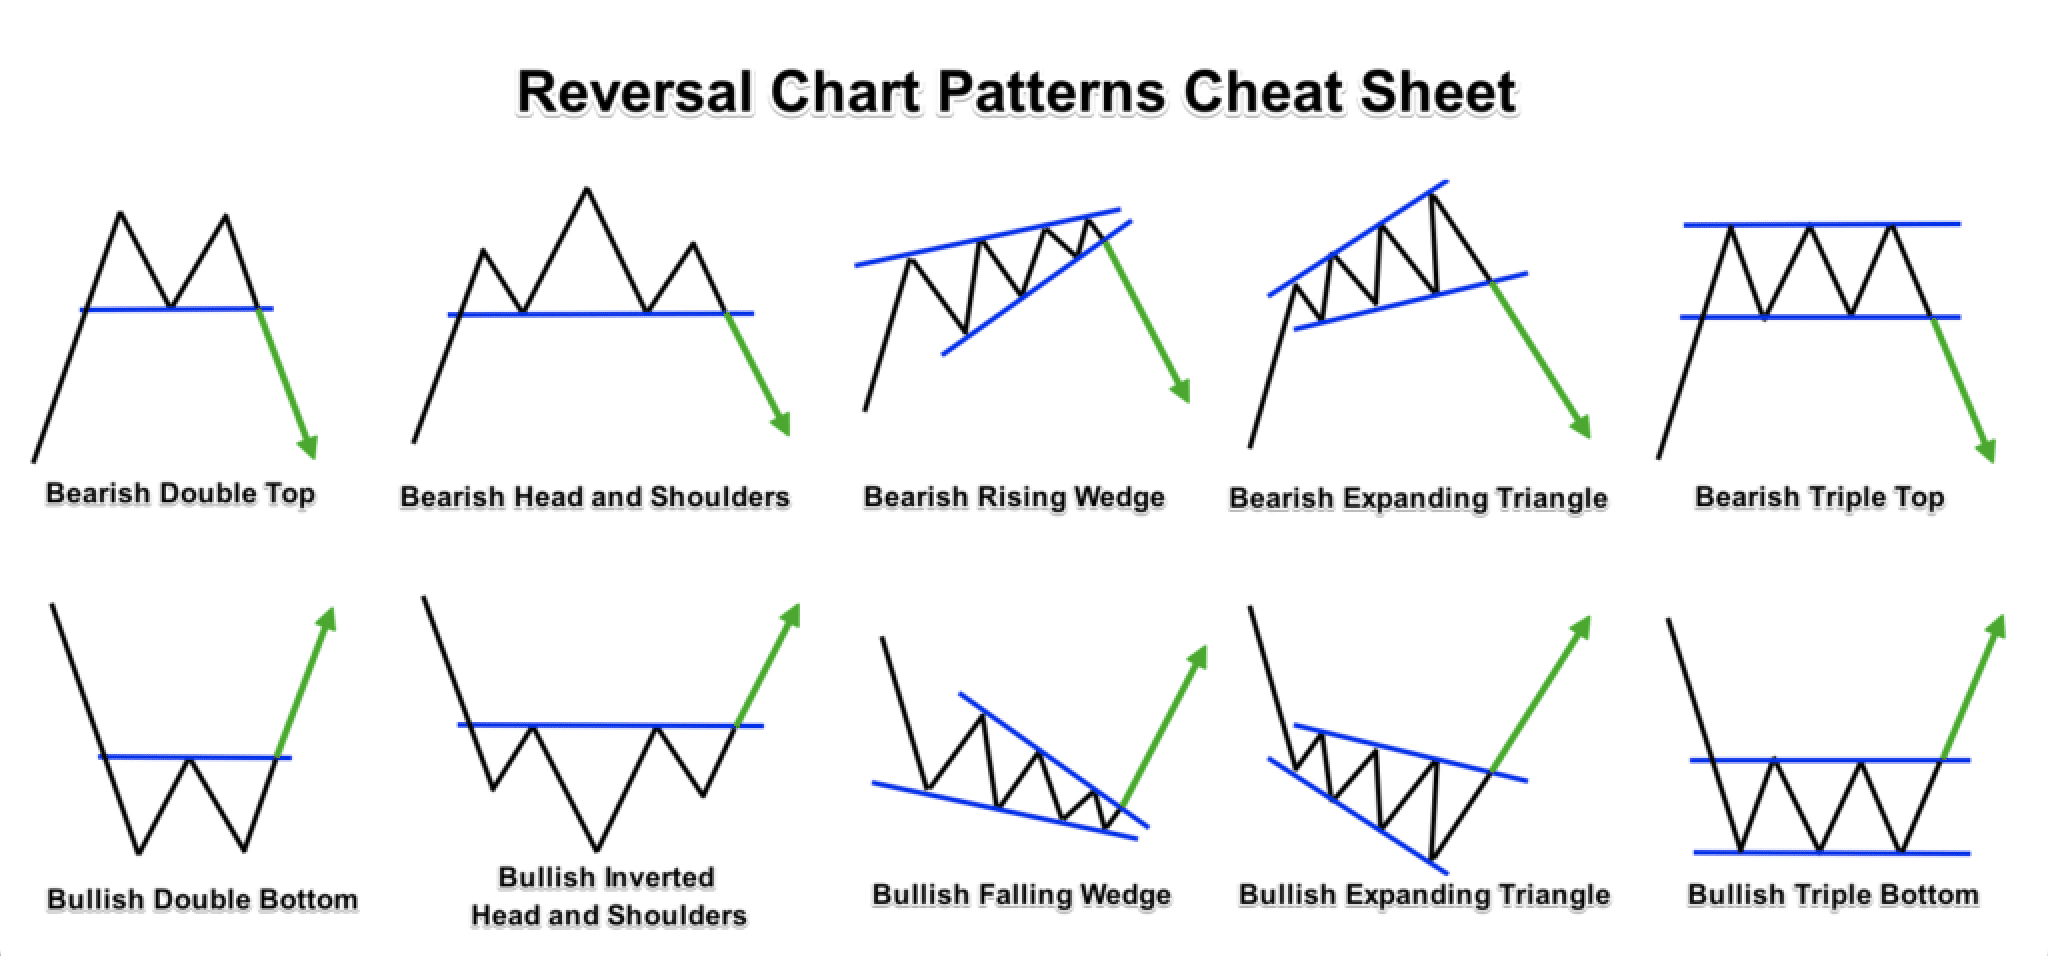
Head and Shoulders Pattern
The head and shoulders pattern is one of the most well-known reversal patterns. It consists of three peaks: the middle peak (the "head") is higher than the two others (the "shoulders"). When you spot this, it’s a sign that the market may reverse from a bullish to a bearish trend.
Double Top and Double Bottom
The double top looks like an “M” on a price chart and indicates a bearish reversal, while the double bottom resembles a “W” and signals a bullish reversal. These patterns form when the price tests the same resistance or support level twice and fails to break through, signaling a possible trend reversal.
Triangles and Their Meaning
Triangle patterns show periods of consolidation before the price breaks out in one direction. The three main types of triangles are:
- Ascending Triangle: Bullish pattern with higher lows.
- Descending Triangle: Bearish pattern with lower highs.
- Symmetrical Triangle: Can break either way, signaling indecision in the market.
Continuation vs Reversal Patterns
As mentioned earlier, continuation patterns suggest the current trend will continue, while reversal patterns hint that the trend is about to change. Patterns like flags, pennants, and rectangles are classic continuation patterns. Understanding this difference is crucial for making informed decisions.
Importance of Volume in Patterns
Volume, or the number of shares traded, plays a critical role in confirming chart patterns. Think of volume as the market’s “voice” — the louder it is (higher volume), the more significant the pattern. A pattern forming with low volume might not be as reliable.
How to Use Chart Patterns in Trading?
Using chart patterns in trading course is like having a compass in the wilderness. They won’t always guarantee success, but they can point you in the right direction. Start by learning to identify the most common patterns, then practice interpreting them in real-time before making decisions.
Common Mistakes to Avoid
When using chart patterns, it’s easy to get caught up in the excitement. One mistake is seeing patterns that aren’t really there (this is known as "pattern confirmation bias"). Another mistake is ignoring volume — without it, a pattern might not be as strong as you think.
Conclusion
Chart patterns are invaluable tools that help traders make sense of the financial markets. By recognizing these patterns, you can improve your ability to predict price movements and make more informed trading decisions. Remember, no pattern is foolproof, and it's essential to combine your pattern analysis with other tools and strategies.